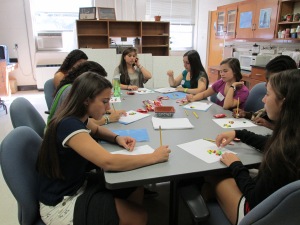
Recently I got the chance to host some high-school students in the lab and show them what I do as a graduate student. My motivation was mainly that I enjoy teaching, and I know that when I was a high-school student I would have enjoyed seeing what a theorist actually does. This project was part of UNC’s Academic Day: according to the organizer, biology was the most popular major to explore during this event that hosts high school students from around the state to show them what universities are all about.
I told them what I do day-to-day, what the track is for someone getting a Ph.D. and the nature of my research. I then explained some basics of population genetics, like the Hardy-Weinberg trinomial and a few other things. Then we conducted an activity where the goal was to show the action of natural selection and genetic drift. This was the fun part.
The Activity
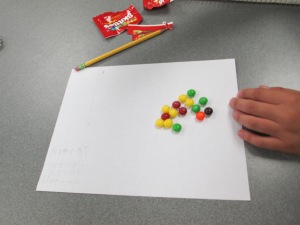
I had eight students, all female, and all but one with brown eyes. This in itself could have provided data for an activity, but I had brought “populations” of Skittles. The students started each with a population of twenty Skittles and measured the frequencies of each color (the “phenotype”). Having a population of twenty makes calculating frequencies easy: just multiply by five and you’ve got a frequency out of 100. Most of the students had a predominance of one color. I provided them with paper and pencil, since they were visiting.
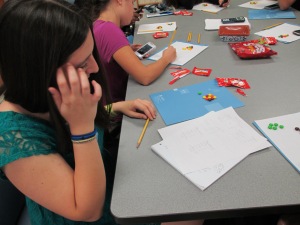
First I asked the students to come up with a way of coding (and hence measuring) the phenotype. I had already come up with a method that the students found acceptable, which was to score the colors from 1 to 5 starting with green, so that green = 1, yellow = 2, orange = 3, red = 4 and purple = 5. Then the students measured the average phenotype by multiplying the frequencies and color scores. Then came the eating: students on the left side of the table ate 10 Skittles randomly; the students on the right of the table at according to some rule that they were free to concoct. The left side represented genetic drift, and the right side selection. The goal of the experiment was to see how much the average trait value would change between the parent population (before eating) and the offspring population (after eating).
The results were interesting: I really didn’t know if this would work, or if the students would care enough to actually try it. The mean phenotypes on the genetic drift side of the table changed very little, but several of the students lost a color in the process, which represents the loss of alleles that can happen with drift. The means on the selection side of the table did change, but what was more interesting was that the students all chose different rules. Some started by eating green and progressed to yellow when they ran out of green. This represents directional selection, or selection against one extreme phenotype. Some started at the other end with purple, which is also directional selection. Others ate from both ends of the spectrum (green and purple, progressing to yellow and red). This corresponds to stabilizing selection, or favoring intermediate phenotypes. Others started with orange; this results in disruptive selection, that penalizes intermediate phenotypes. I did not plan on telling them about these modes of selection at the outset. This was a very pleasant accident.
Thoughts and conclusions
The biggest obstacle was time: I only had about forty minutes with these young ladies, and so telling them about graduate school and doing the experiment was kinda tight. Another interesting way to do things might have been to use their own physical characteristics (e.g. hair and eye color) as the data, but I didn’t think of that until I saw the Founder Effect that had landed in our lab: they all had brown eyes, except for one student. I explained that if they were to form a parthenogenetic colony on an island somewhere, that after a few years either all their offspring would have blue eyes or brown eyes. This joke might have been a little more uncomfortable to hear had there been any dudes in the room other than me.
I was really glad to have the chance to show these students that theory is a part of science. Without showing them any high-tech gear I was able to show them what I do as a scientist. People, especially young people, often confuse measurement for science, and the techniques of science with the actual intellectual exercise of science. Honestly I was surprised to be surrounded by eight eager teenagers as soon as I held up my hand and said “evolutionary theory.” I expected everyone would want to hear about more sexy things like developmental biology.

This is really cool! As a student I would have loved this kind of “skittle science.” Making statistics and predictions could be dull as watching paint dry but you make it applicable and that is a true art. Thanks for passing on this article.
Clare
Passing this on to my FB page.
Pingback: Aula Prática: Doce Probabilidade Genética | Aula na Prática